
Industries
Where the constraints are real.
We work where operations are the business — physical, regulated, capital-intensive and unforgiving of theory.

Manufacturing
Capacity, quality and cost per unit — rebuilt line by line.
Industry challenges
- Unstable line rates
- Scrap and rework drag
- Skilled labor gaps
- Deferred capital
Typical engagements
- Plant turnaround
- OEE improvement program
- Multi-site footprint strategy
- Automation business case
Velocity approach
We run the floor with your team: constraint mapping, daily management, standard work and a capital plan tied to throughput — not wish lists.
- Line throughput
- +18%
- Cost of poor quality
- -30%
- Automation payback
- <12mo
Line throughput
Cost of poor quality
Automation payback

Healthcare
Capacity and cost without adding administrative weight.
Industry challenges
- Throughput bottlenecks
- Premium labor spend
- Supply cost inflation
- Fragmented service lines
Typical engagements
- Patient flow redesign
- Perioperative throughput
- Supply chain cost reset
- Labor model rebuild
Velocity approach
Clinical and non-clinical flow engineered together, with frontline leaders owning the daily metrics that govern patient movement.
- Length of stay
- -1.4d
- OR utilization
- +22%
- Supply spend
- -9%
Length of stay
OR utilization
Supply spend
Distribution
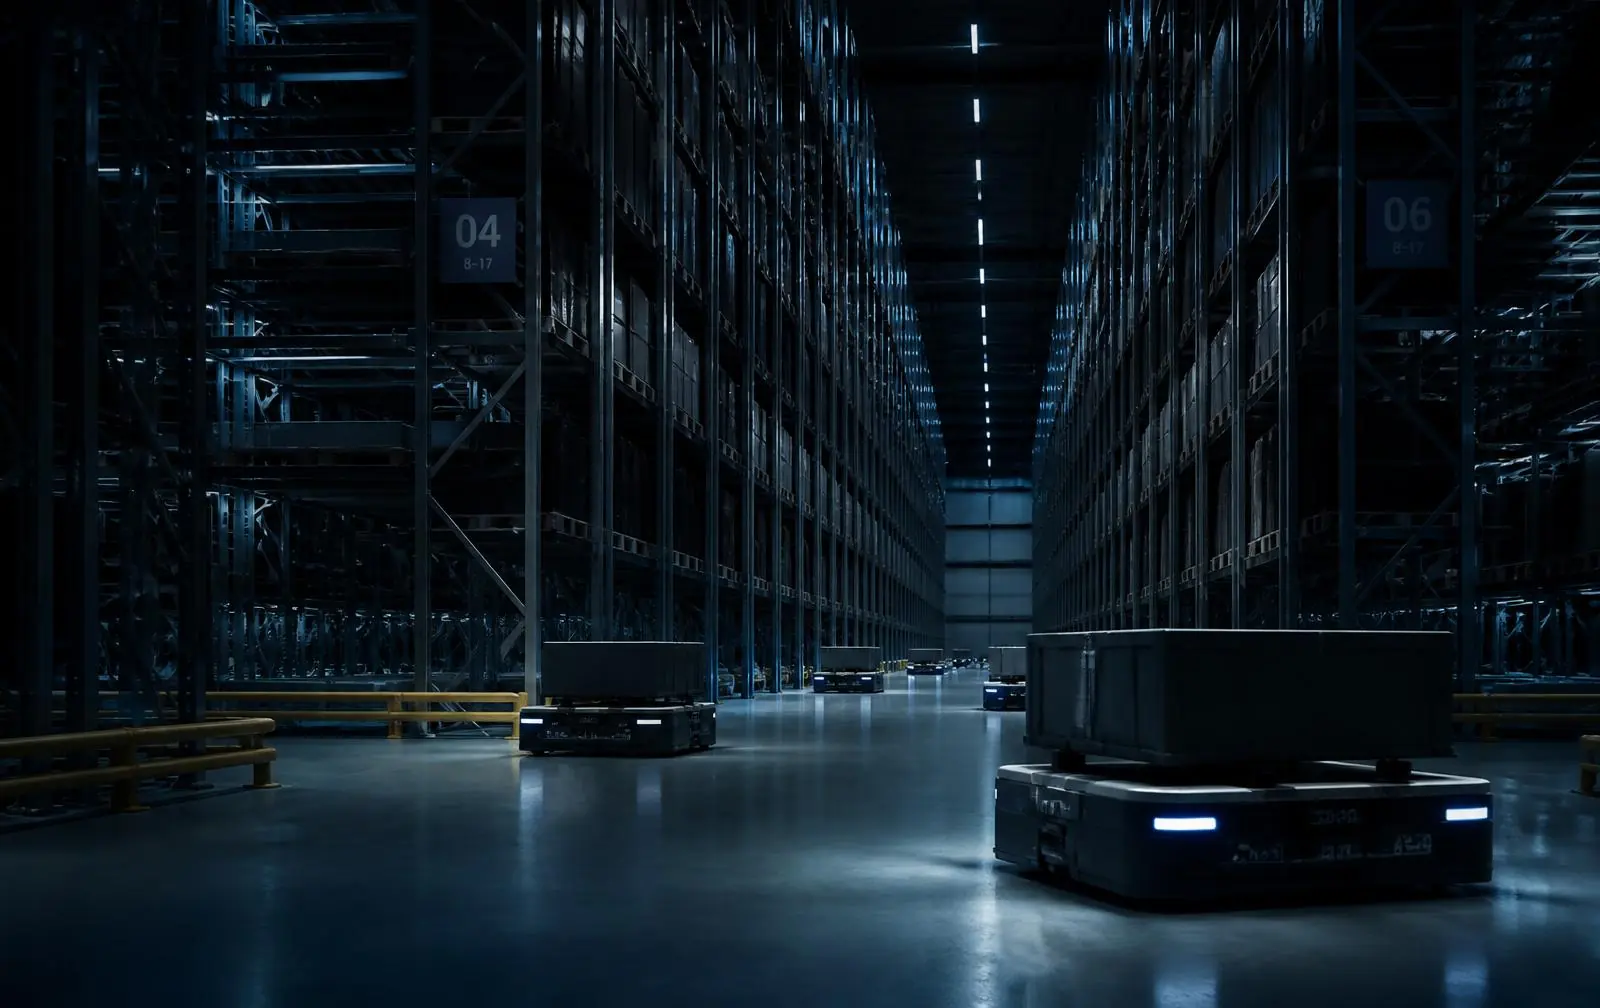
Fulfillment productivity that scales without proportional headcount.
Industry challenges
- Peak volatility
- Pick productivity plateau
- Slotting decay
- Service failures
Typical engagements
- DC productivity program
- Engineered labor standards
- WMS enablement
- Peak readiness
Velocity approach
Labor standards, slotting science and an hourly management system — installed on the floor, then held by your supervisors.
- Units per hour
- +25%
- Order accuracy
- 99.8%
- Cost per order
- -15%
Units per hour
Order accuracy
Cost per order
Supply Chain
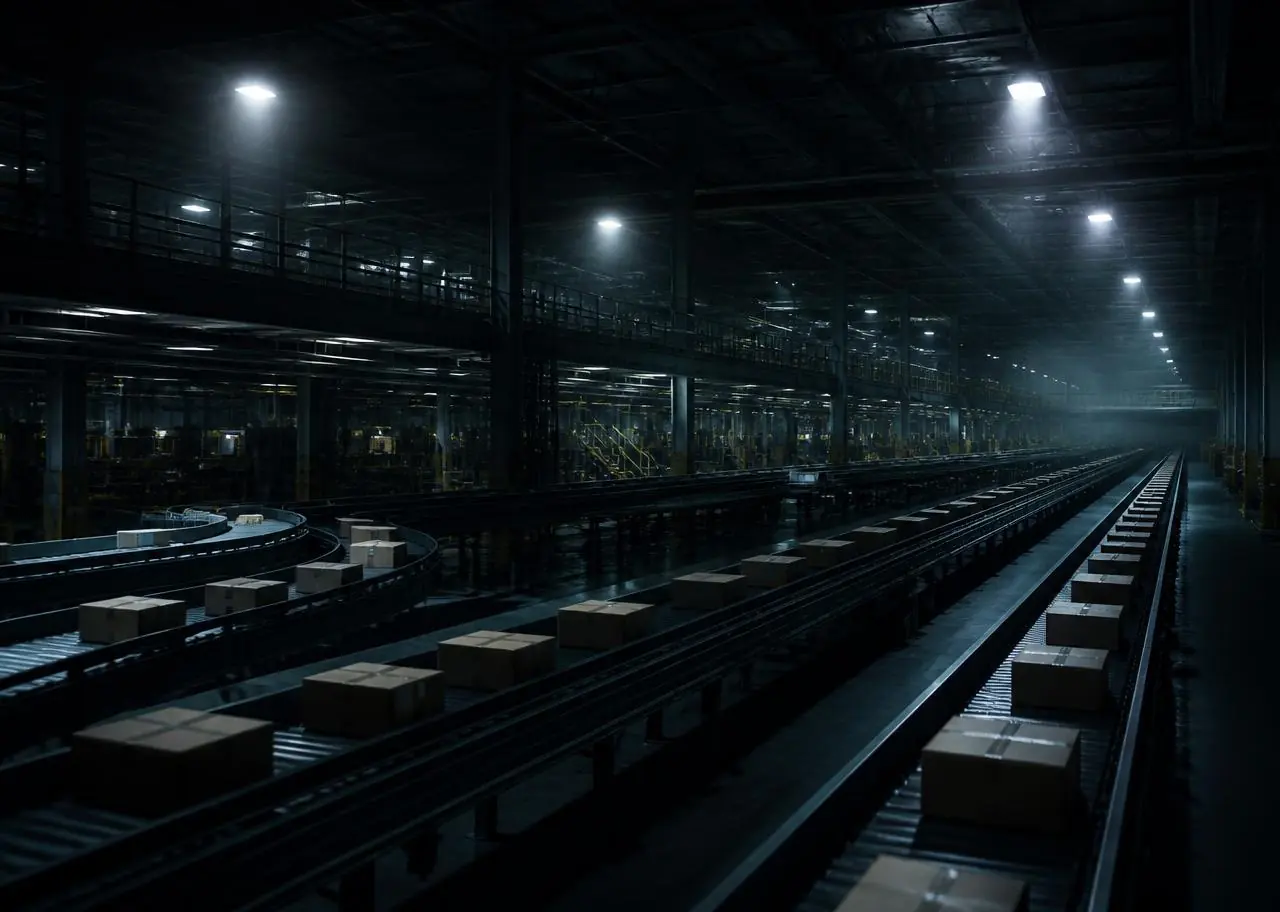
Service, speed and working capital improved at the same time.
Industry challenges
- Inventory in the wrong places
- Immature S&OP
- Freight cost creep
- Single-source exposure
Typical engagements
- Network design
- S&OP maturity build
- Inventory optimization
- Sourcing risk reset
Velocity approach
Network and inventory modeled against real demand signal, then an executive S&OP cadence that makes the trade-offs explicit.
- Working capital
- -20%
- Fill rate
- +6pts
- Landed cost
- -11%
Working capital
Fill rate
Landed cost

Automotive
Tier discipline, launch readiness and margin under program pressure.
Industry challenges
- Launch slippage
- PPAP and quality escapes
- Program margin erosion
- Tier-2 fragility
Typical engagements
- Launch recovery
- Supplier development
- Program cost-down
- Quality systems rebuild
Velocity approach
Program governance with real gates, supplier development on site, and a cost-down roadmap owned by engineering and operations jointly.
- Missed launch gates
- 0
- PPM defects
- -45%
- Program margin
- +3.5pts
Missed launch gates
PPM defects
Program margin

Hospitality
Guest experience protected while the cost base is re-engineered.
Industry challenges
- Labor volatility
- Inconsistent service delivery
- Property-level cost drift
- Weak field accountability
Typical engagements
- Multi-property operating model
- Labor scheduling reset
- F&B margin program
- Field leadership build
Velocity approach
Standard operating rhythm across properties, labor models tied to occupancy, and a field leadership cadence that travels.
- GOP margin
- +7pts
- Labor cost
- -12%
- Guest score
- +0.6
GOP margin
Labor cost
Guest score

Real Estate
Portfolio operations run with the rigor of a manufacturing business.
Industry challenges
- Opaque property performance
- Capex overruns
- Vendor sprawl
- Slow lease-up execution
Typical engagements
- Portfolio operating review
- Capex governance
- Vendor consolidation
- Lease-up acceleration
Velocity approach
One performance architecture across the portfolio: standardized reporting, capital gating and a vendor structure that earns its cost.
- Opex per sq ft
- -14%
- Capex variance
- -22%
- Faster lease-up
- +90d
Opex per sq ft
Capex variance
Faster lease-up
Private Equity
Operating partners accountable to the thesis, not the deck.
Industry challenges
- Diligence blind spots
- Stalled value creation plans
- Thin management benches
- Exit readiness gaps
Typical engagements
- Operational due diligence
- 100-day plan execution
- Interim COO placement
- Exit readiness
Velocity approach
Ground truth before the wire, a 100-day plan with named owners, and interim leadership in the seat until the gain is durable.
- To first EBITDA lift
- 100d
- Plan capture rate
- +2.1x
- Diligence to plan
- 4wk
To first EBITDA lift
Plan capture rate
Diligence to plan
Next step
Tell us the number you need to move.
A 30-minute conversation is usually enough to know whether we are the right operators for the problem in front of you.